
Although flood forecasting is not new in Australia, and is generally undertaken by the Bureau of Meteorology, it has been limited to catchments with sufficient natural warning time. However, many communities are affected by flooding from flashier rivers and creeks for which flood forecasts are not issued by the Bureau.
These communities would benefit from advanced warning of impending flooding, including those areas at risk of flash floods. As a result, flood forecasting is now a key focus for government authorities and businesses responsible for emergency response, asset security and business interruption, to ensure the people in these communities are provided with sufficient warning to get to safety, and minimise economic losses.
The base datasets required to develop real-time flood forecasting systems are generally readily available to councils and government authorities, and even some private enterprises. By making use of this available information, an effective flood forecasting system that takes predictions of flood levels at any location, and determines the likely flood outcome, can be developed. Such a system only provides an indication of what the flood is likely to ‘look like’, but allows the probable impacts to be determined, and emergency responses to be planned.
Flood forecasting data requirements
The increasing ease and detail in which computer flood models can be setup and run has led to a large volume of flood model outputs being held within councils and government agencies. This flood data combined with a wide variety of available spatial data - aerial imagery, terrain surfaces, property, road, and facility datasets – provide a rich collection of information for use in flood forecasting.
A basic flood forecasting system can be quickly developed using available datasets, including:
- Flood surfaces (generally from flood model outputs) for a range of flood magnitudes
- Digital Elevation Models (DEM) often from LiDAR
- Forecast flood levels in the catchment (e.g. likely catchment and/or storm surge levels)
To enhance the sophistication and capability of the system to provide insight into the likely behaviour of a flood, additional datasets can be incorporated such as:
- Actual and forecast rainfall, as well as catchment conditions
- Real-time hydrologic modelling
- GIS datasets of properties, roads, critical infrastructure etc.
Flood Intelligence
The graphic below illustrates the general data flow of a real-time flood forecasting system to generate valuable flood intelligence for emergency response teams, government agencies, businesses and communities.
Insert inf
Flood intelligence is typically created through the integration of a forecasted flood surface with external spatial datasets. The aim of such flood intelligence is to distil the technically complex components of a flood forecasting system into readily understood and meaningful information. Its aim is to address questions such as:
- What will the flood look like?
- Who will be at risk?
- When will they be at risk?
- What roads will be open?
- What critical infrastructure will be operational?
The simplest piece of information a flood forecasting system provides is a flood extent map, which is limited to identifying the flooded area and the potential for properties and infrastructure to be affected.
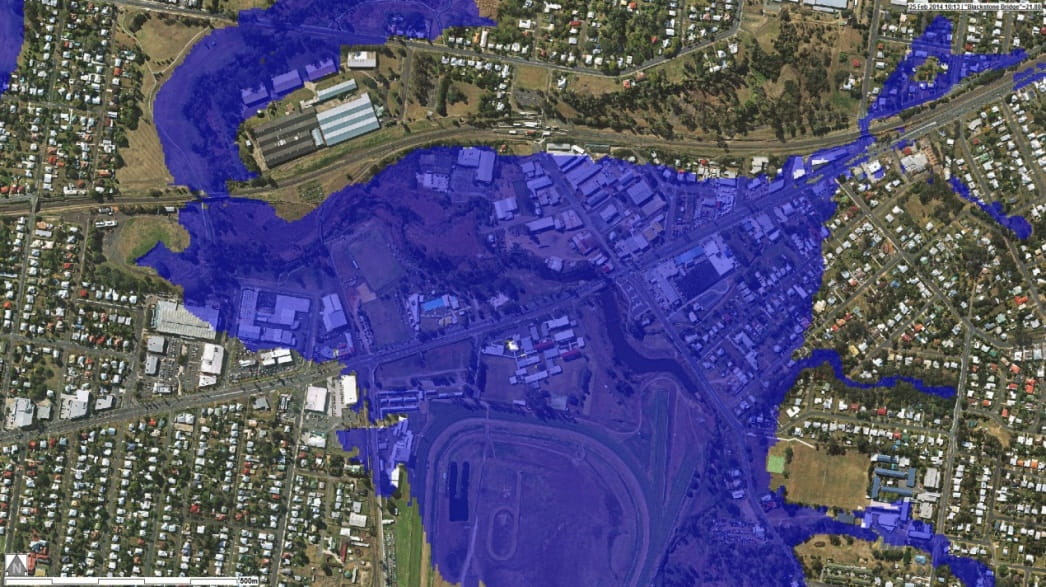
Figure 1 – Sample flood extents.
Taking this a step further, a flood depth surface can be created by draping the forecast water surface onto a Digital Elevation Model (DEM). The depth of the surface not only provides information on the likely flood extent, but also on the severity of flooding - in terms of depth - across a region.
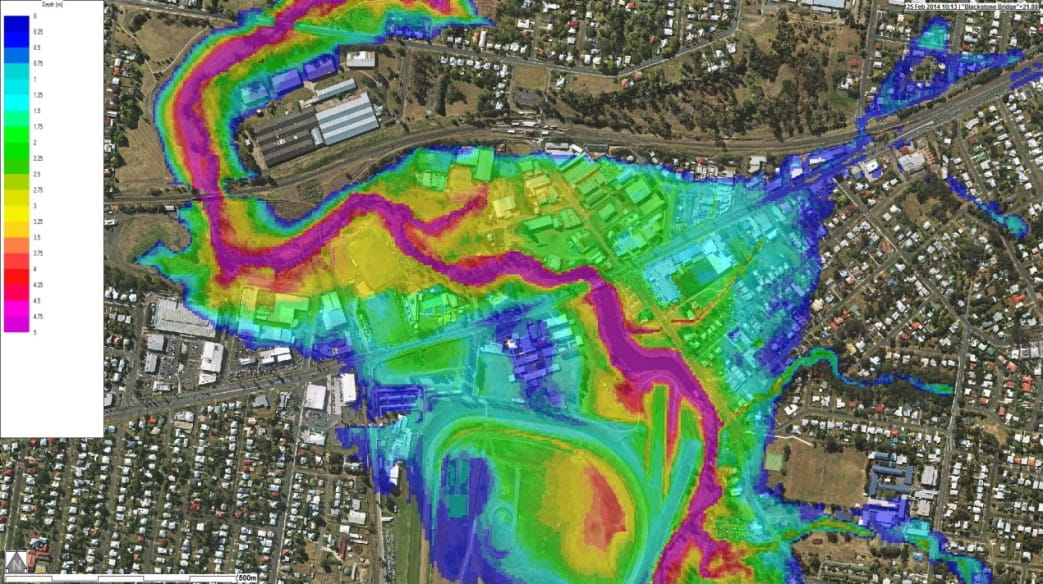
Figure 2 – Sample flood depth surface.
However, the richest source of flood intelligence can be created by integrating the forecast flood surface with GIS datasets. GIS datasets contain attribute fields which can be used to determine the impact of flooding on an object. For example, a GIS dataset may contain the base levels on all transformers for electricity sub-stations in a region. By integrating the forecast flood surface with the levels in this field in the GIS dataset, an indication of whether power will be available to the region can be quickly ascertained.
As an example, Figure 3 shows a thematic map of the depth of flooding ‘above floor’ for flood-affected properties, within a flooded region for a given forecast. Other examples might include low points on evacuation routes to determine what roads are passable, or what facilities require managed evacuation, for example a nursing home.
In addition to peak forecast information, time-based flood forecasts add additional detail to flood intelligence, providing information on not only what will be affected, but when.
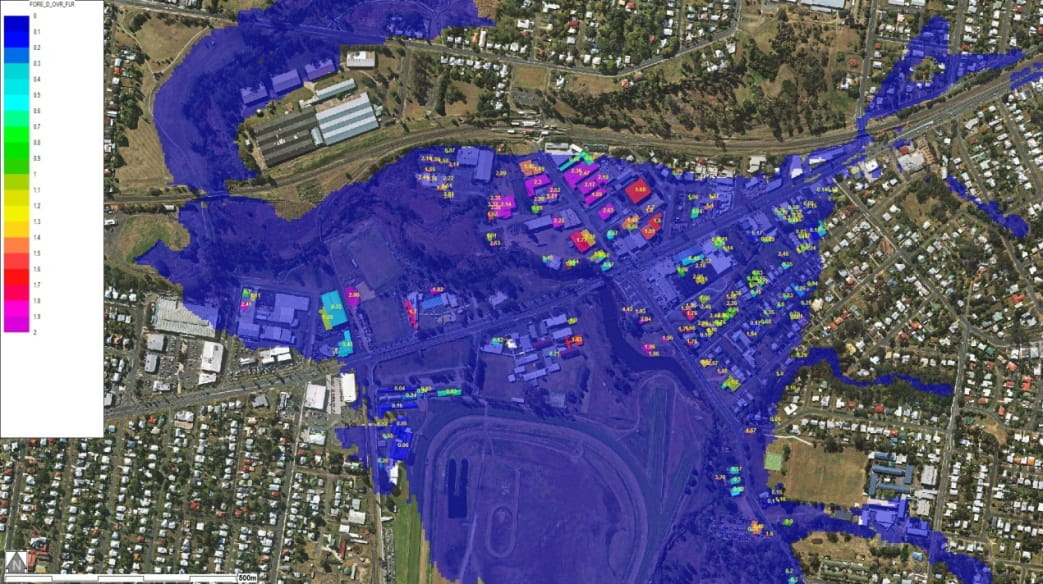
Figure 3 – Depth of above floor flooding.
Managing Flood Uncertainty
The variability of factors affecting flooding means that forecasting floods inherently involves a significant amount of uncertainty. Generally as a flood event progresses, the confidence in the likely outcomes increases but the response times reduce. For systems with sufficient natural lag, this is useful. For catchments subjected to flash floods, this certainty comes too late.
Causes of uncertainty can be quite varied, from the ability to accurately predict likely rainfall, to the vagaries of catchment rainfall runoff and errors in underlying modelling datasets.
A conceptually simple way to address the issue of uncertainty is to look at the implications of the potential uncertainty; by quantifying the upper and lower limits of uncertainty, it’s possible to determine if it has a material impact on what the response to the likely flooding should be.
For example, Figure 4 shows three surfaces from a flood forecasting system employing rapid interpolation techniques. The blue surface represents the flood extent associated with expected rainfall of 150mm over the next 4 hours. The yellow surface represents the extent of 20% less rainfall (i.e. 120mm over 4 hours), and the red surface the extent for 20% more rainfall (i.e. 180mm over 4 hours).
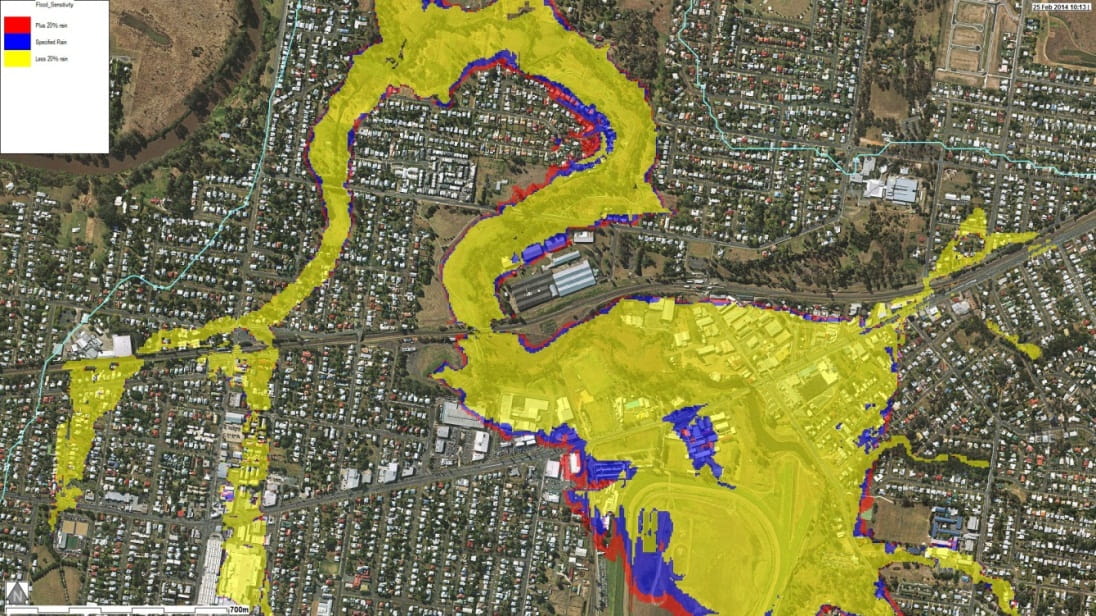
Figure 4 – Managing forecast uncertainty: Blue = flood surface for expected rainfall, yellow = flood surface with 20% less rainfall, red = flood surface with 20% more rainfall
Figure 4 clearly shows from an emergency management perspective that there is little difference between the upper and lower uncertainty bounds (the red and yellow surfaces). Although there may be significant uncertainty in the forecast, there is actually relative certainty in the outcome of the forecasted flood in terms of the community that will be affected and what response actions will be required.
Information distribution to limit flood impacts
Whilst the flood intelligence generated from a flood forecasting system serves the informational requirements of end users, the way these users wish to consume the information and share it with a wider audience, such as the general public, is what makes a system most effective.
Such detailed intelligence demonstrated above can be used by emergency managers to plan and prioritise response effort, and a simplified version can be pushed out to affected communities through SMS alerts and web maps of affected areas.
This can keep communities safe; it can save lives.
This is what you can do with your data.
Click here to download an infographic summary of this article.
References
-
http://www.australiangeographic.com.au/topics/history-culture/2012/03/floods-10-of-the-deadliest-in-australian-history/